Wind Tre Network Modernization
Wind Tre Network Modernization
An operator in central Asia carried out a proof of concept with CellMax antennas to see if a change in antennas could improve high-band coverage and move traffic to it from its old low-band network. It not only succeeded, but the ROI was only a few months.
In the test, a cluster of 21 sectors, optimized by an OEM, were swapped. The carrier wanted to increase quality in the high-band network, increase the area where it was available, and increase the amount of traffic on the high band instead of the old low band.
The test showed an increase in perceived network quality, indoor and outdoor coverage, traffic load and user data speeds. Notably, there was a 55% increase in the high-band service area.
The drive tests showed an average signal level improvement within test sector of +5.6 dB, an improvement of 263%. For the pre-bins with the lowest signal level (Below -80 dBm), the average improvement was 8.7 dB, an improvement of an astounding 641%.
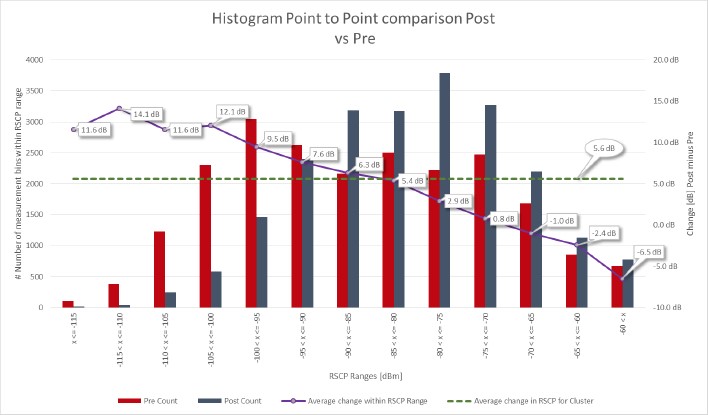
The graph above shows describes the distribution of the number of samples within each signal level range. There is the same number of total bins in pre and post i.e. the sum of all the red bars equals the sum of all blue bars. There is a large shift towards the higher signal levels. The blue bars are higher further to the right. The dashed green line shows the average change for all samples. The purple line shows the average change for the PRE samples within the specified signal level range. For example, the pre bins in the range -110 dBm < Signal level <=-105 dBm have improved +11.6dB (1,250%).
The quality of the network also increased by an average of 0.9 dB (approximately 25%) over all bins and even more in areas with previously weak Ec/Io, where pre-bins with Ec/Io below -14dB increased by 4.0 dB (+148%).
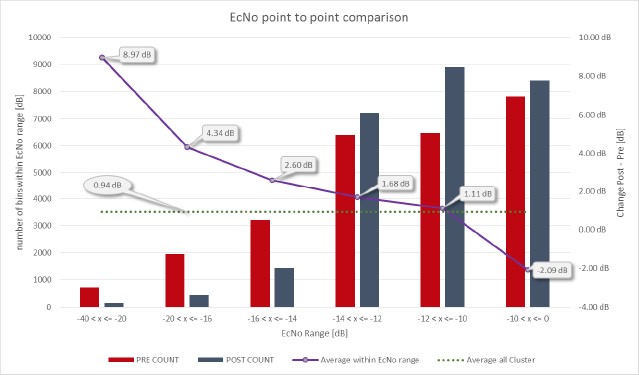
The graph above show the distribution of the number of samples within each Ec/Io range. There is a large shift towards the higher Ec/Io levels. The blue bars are higher further to the right. The dashed green line shows the average change for all samples. The purple line shows the average change for the pre samples within the specified Ec/Io range. For example, in the graph, the pre-bins in the range 25 < Ec/Io <=-20 dB have improved 8.3dB (676%).
In addition, the ability to use improved modulation coding schemes resulted in 10% better bits/s/Hz. This gives the carrier the option to add more subscribers or add load to the network.
The data shows that because the carrier could sell more data due to the swap, ROI in this case was in 136 days. In the case of a new rollout, ROI would be significantly faster, since the alternative antenna price should be deducted from the investment.
Customer cases
Contact
Feel free to call us or send us a message.